• Twitter
  • Vimeo
The Global Harvest


2016 ANNUAL WRAP UP


  • Home
    • Table of Contents
    • Introduction
    • Money Maps of the World
    • Who’s Who in the Transition?
    • And The Winners Are…
      • 2016 Hero: Julian Assange
      • 2016 Movie of the Year: Sully
      • 2016 Documentary of the Year: Vaxxed
      • Let’s Go to the Movies
    • Best Books for 2017
    • Vision 2020
  • Global Harvest
    • Commentary
    • The Agricultural Workforce
    • Food Production
    • Food Natural Resources
    • The Power of Food
    • U.N. Hunger Map
    • Food Stocks by Segment
    • Rising Food Prices ETF
    • Selected Food Graphs & Charts
    • Food Documentaries
    • Money Maps of the World
  • Get Ready
    • Scenario #1: Popsicle Index Rising
    • Scenario #2: Global Musical Chairs
    • Scenario #3: Mind Control
    • Scenario #4: The War Machine
  • Trends & Stories
    • Part I: Commentary
    • I. The Economy & Financial Markets
    • II. Geopolitics
    • III. Culture
    • IV: Science and Technology
    • V: The Unanswered Questions
    • VI: Inspiration
    • Part II: Commentary
  • Markets
    • Commentary
    • Rambus: 2016 Annual Review
    • Fixed Income
    • Equities
    • Commodities
  • Solari Report
  • The Solari Food Series
HomeSelected Food Graphs & Charts

Selected Food Graphs & Charts

FAO Statistical Pocketbook


FAO Statistical Pocketbook for Asia


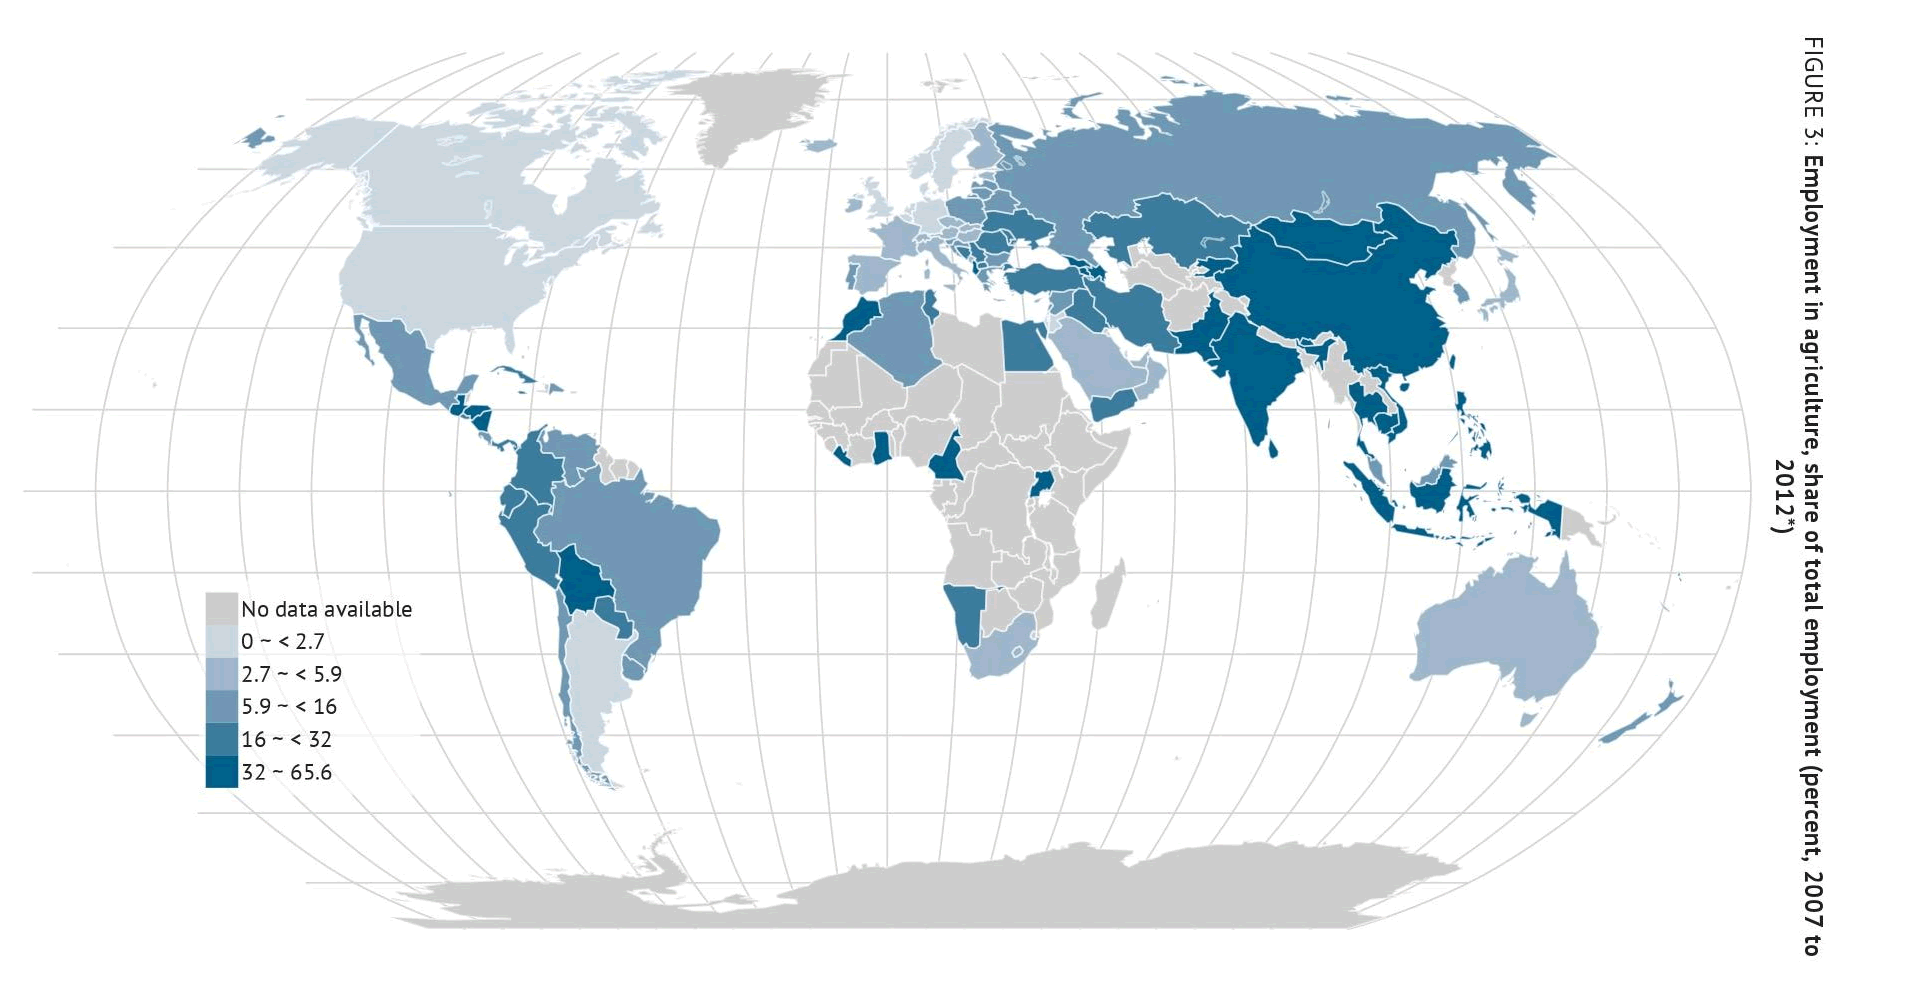
Employment in Agriculture*
employment_in_agriculture


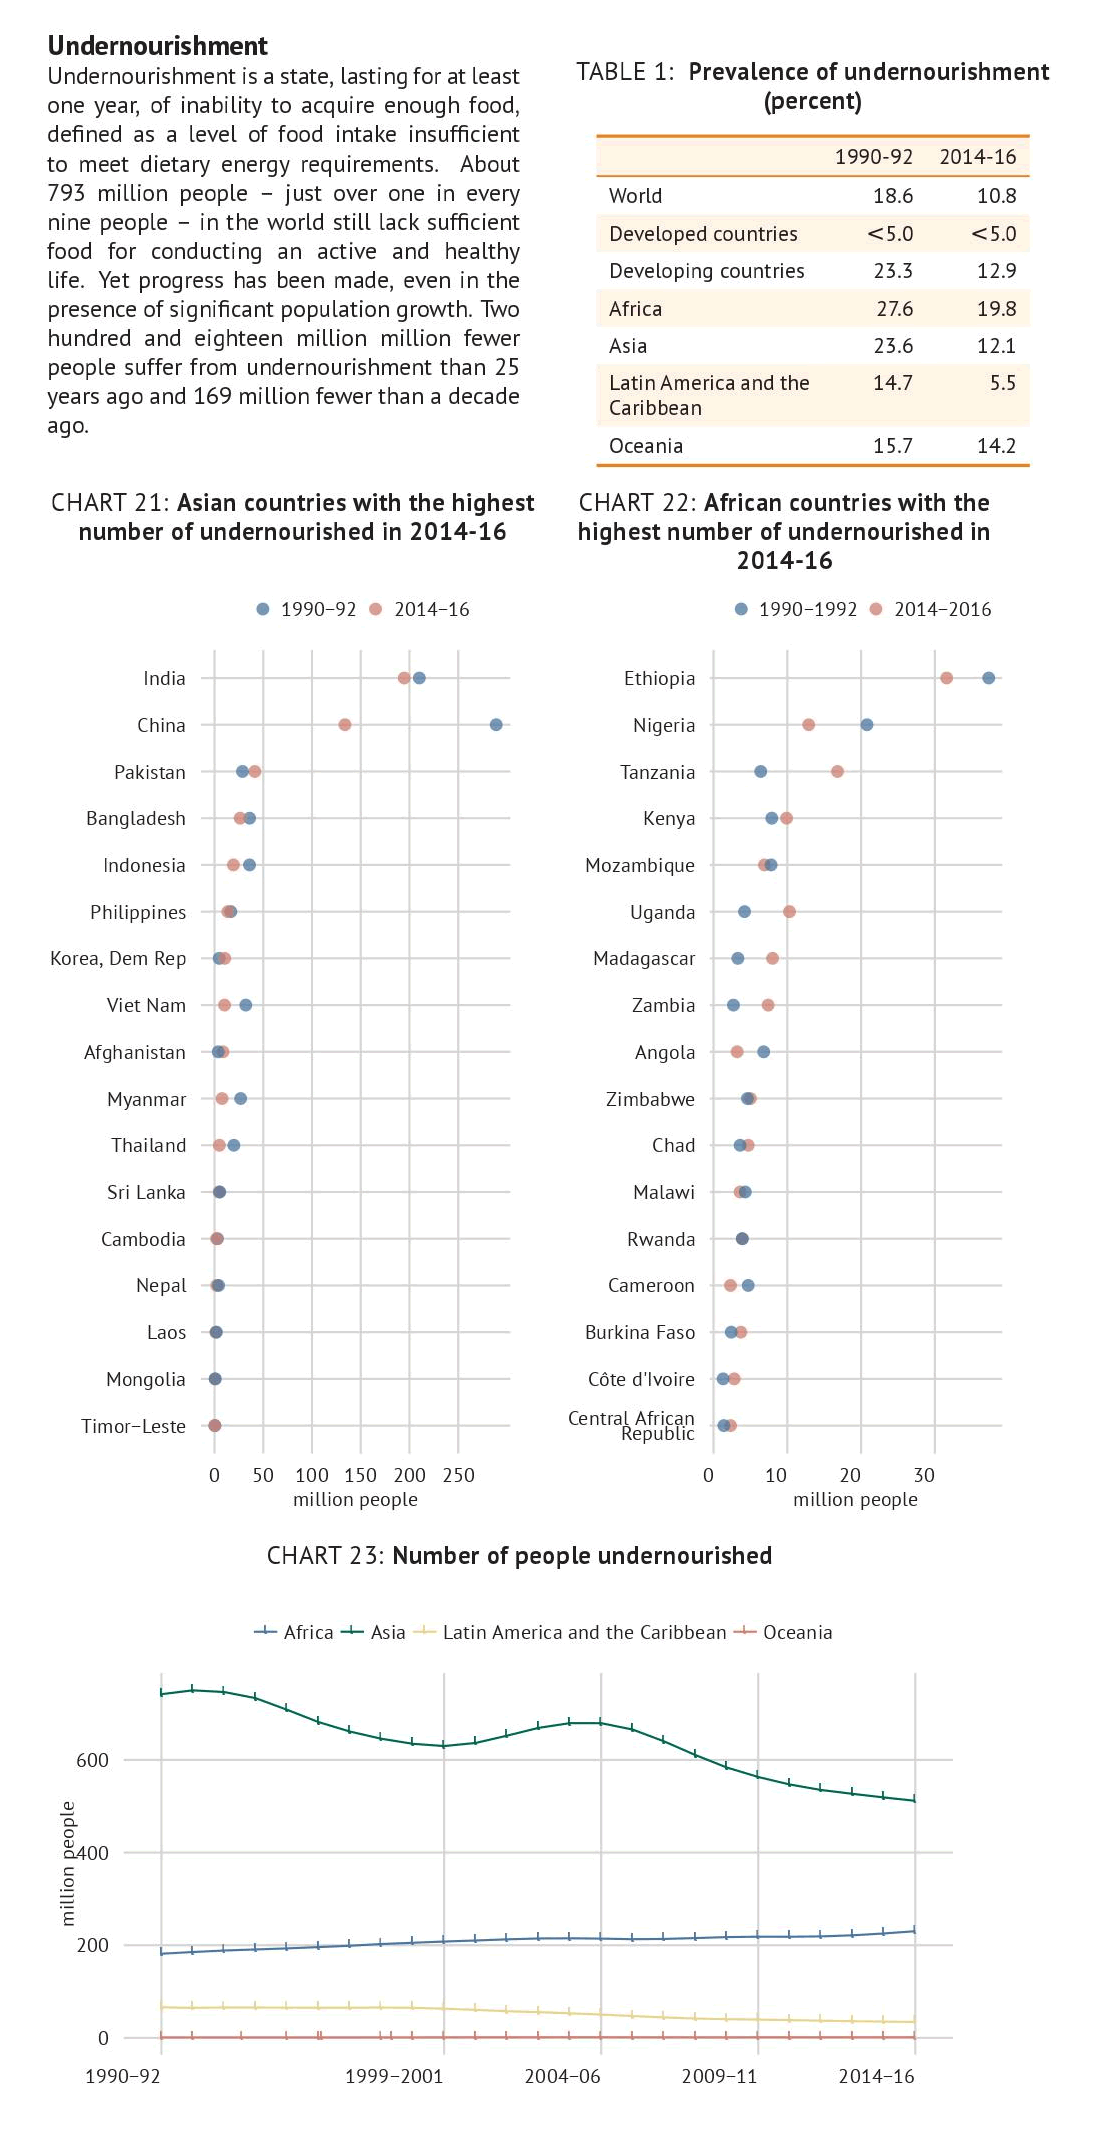
Prevalence of Undernourishment*
undernourishment


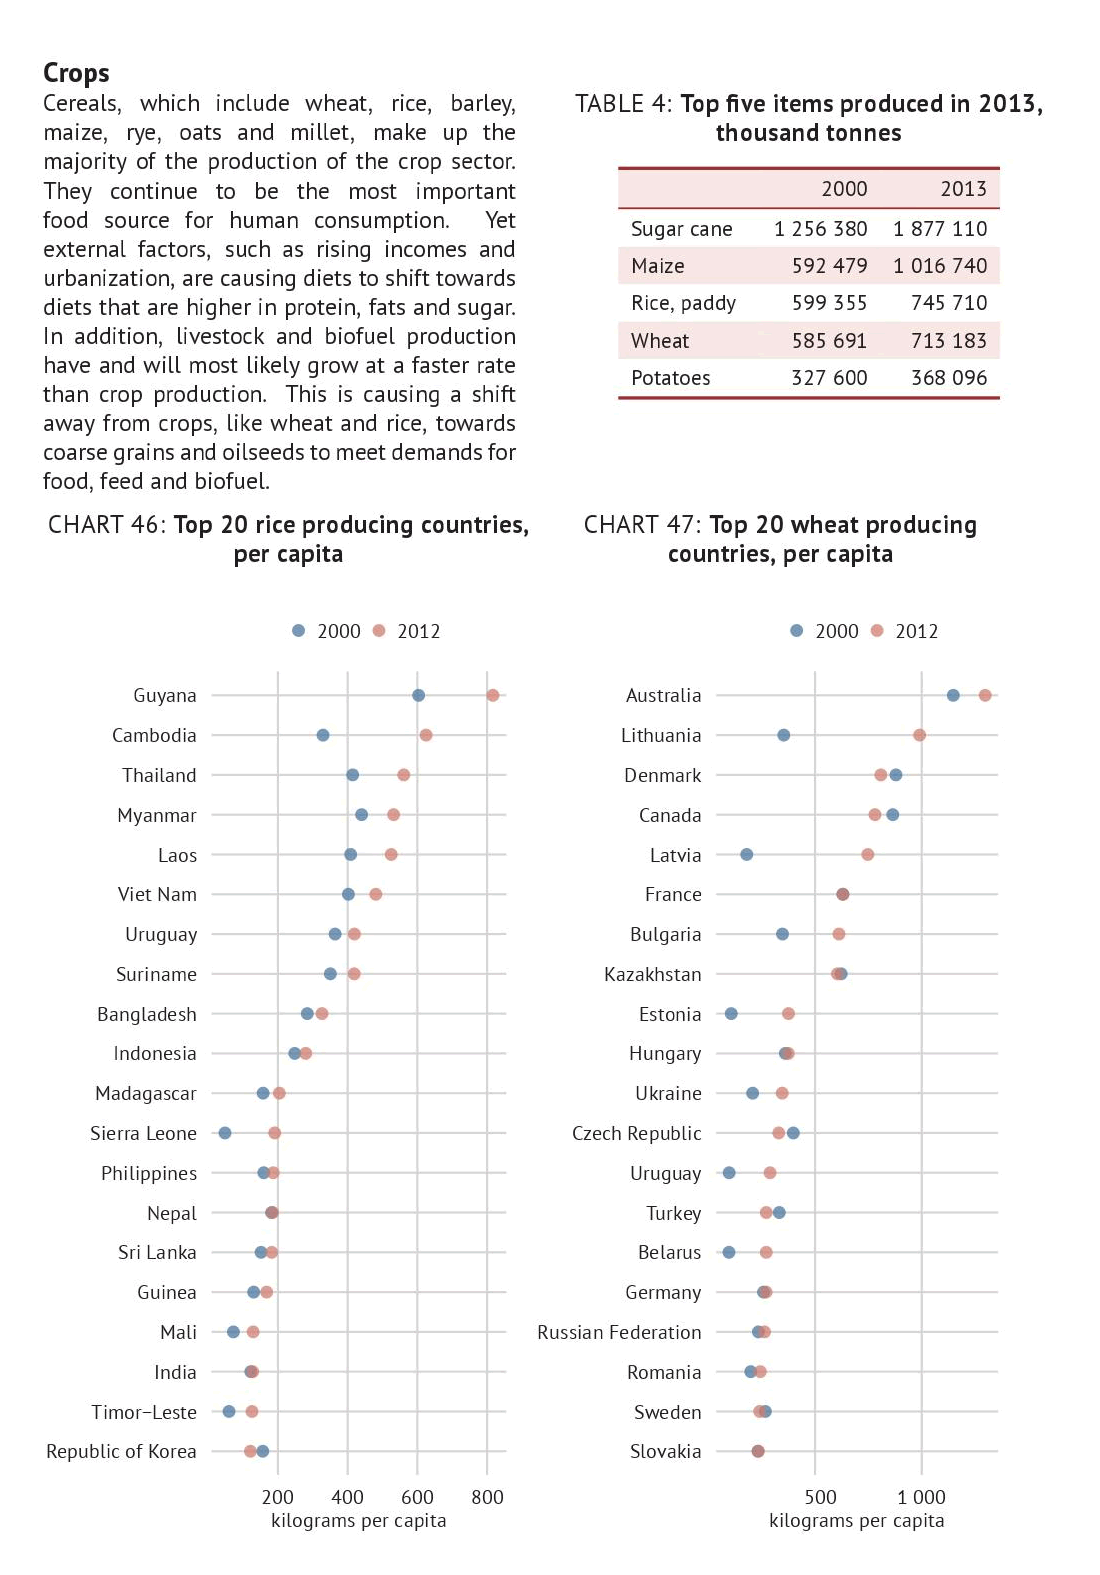
Top Food Items Produced*
top5_items_produced


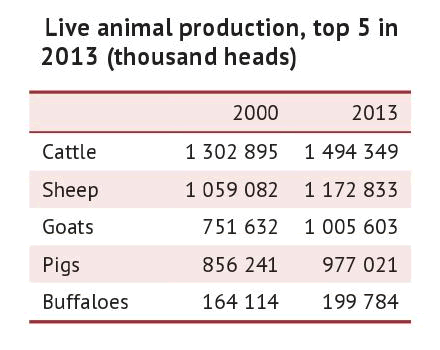
Live Animal Production*
live_animal_production


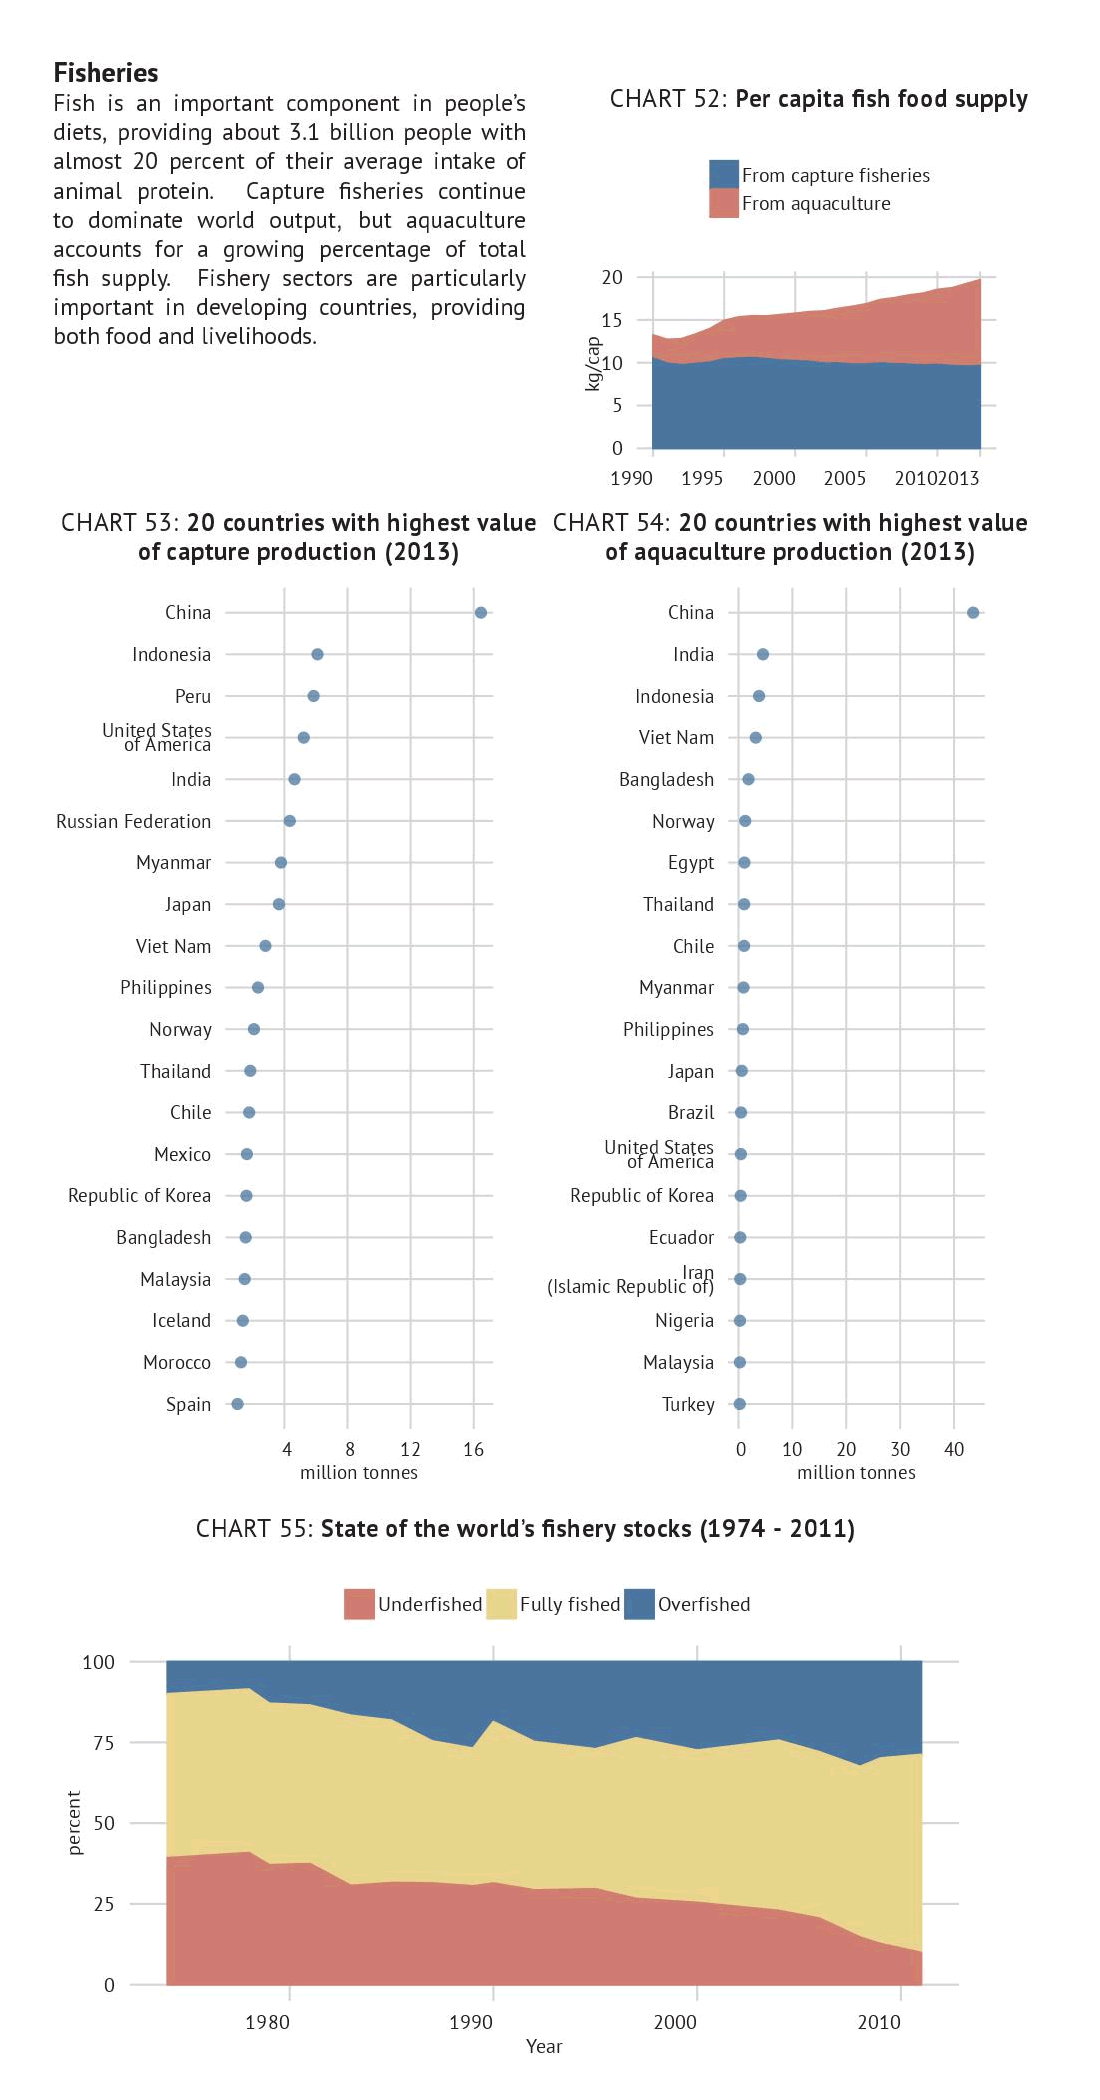
Per Capita Fish Food Supply*
per_capita_fish


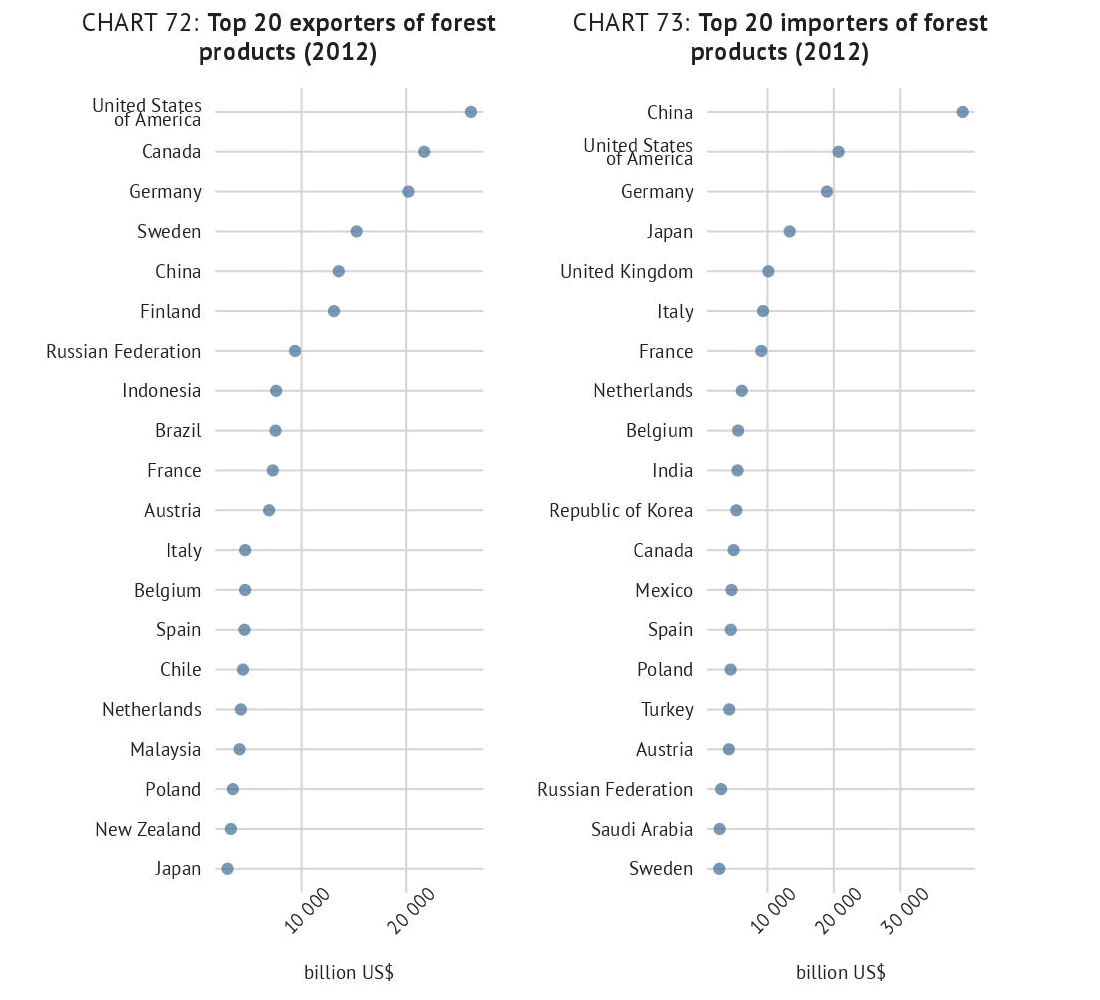
Forest Exports / Imports*
forest_exports_imports


Top Food Importing / Exporting Countries*
food_imports_exports


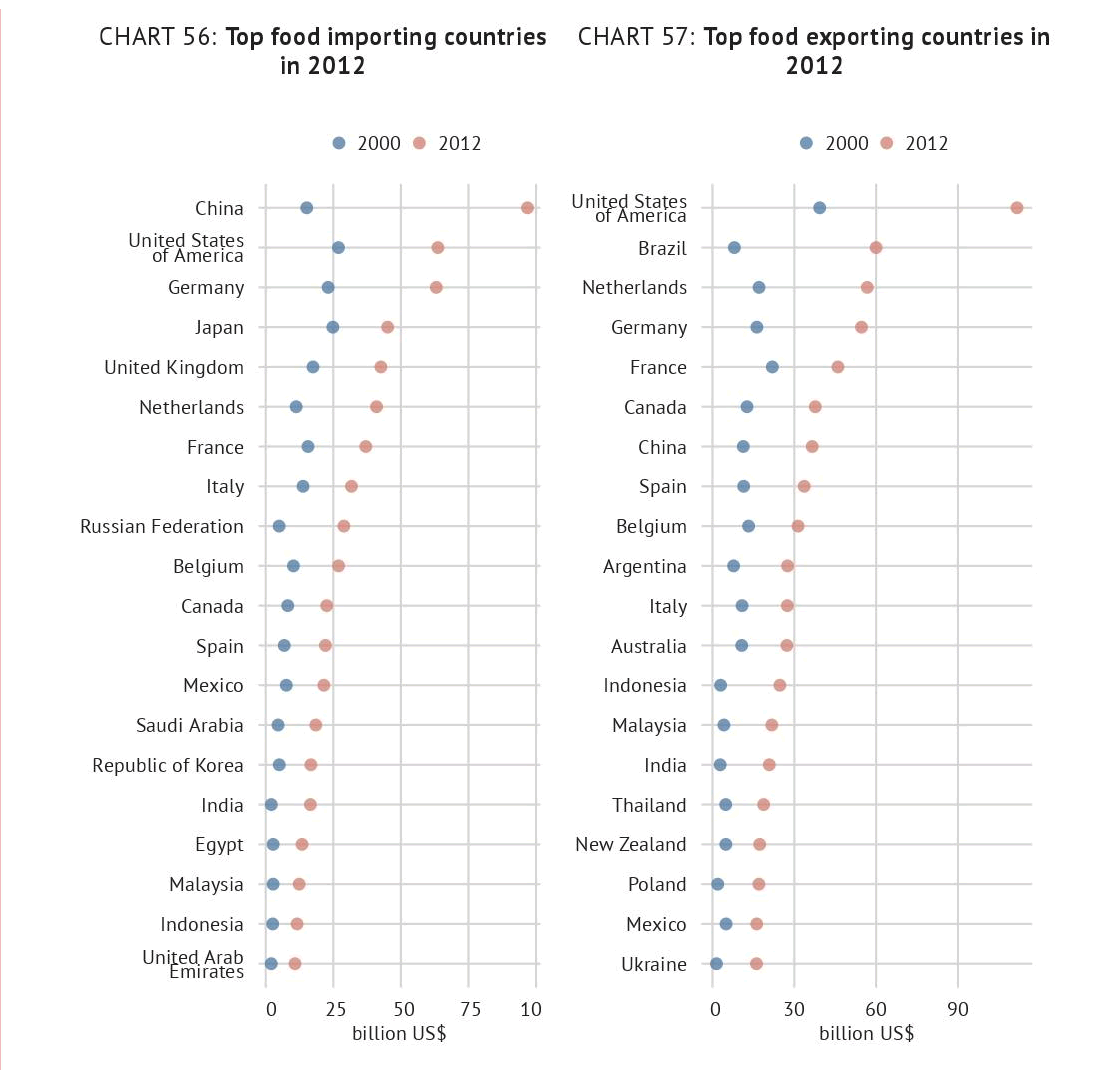
* Source: Food & Agriculture Organization of the United Nations – Statistical Pocketbook

© Copyright 2023 Solari, Inc. All Rights Reserved