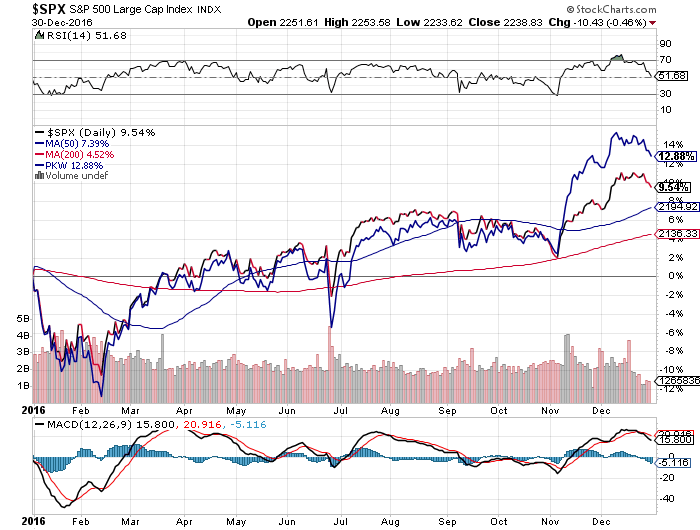
After an astonishing rise in 2013 (S&P total return of 32%), US equity markets performed well in 2014 (14%) and were nearly flat in 2015 (1%) . Given the challenge facing corporations – fewer earnings and labor productivity as well as a strong dollar – we started 2016 with numerous headwinds. In addition, we were significantly overdue for a 15-30% correction. While significantly outperformed by long Treasuries, gold and silver and emerging market equities as of the first half, US equities continued to rise, ending the year with a performance (S&P total return of 12%) ahead of European, developed and emerging market equities, most dollar fixed income markets and gold.
NORTH AMERICA
SPX (S&P Large Cap), PKW (Buybacks)
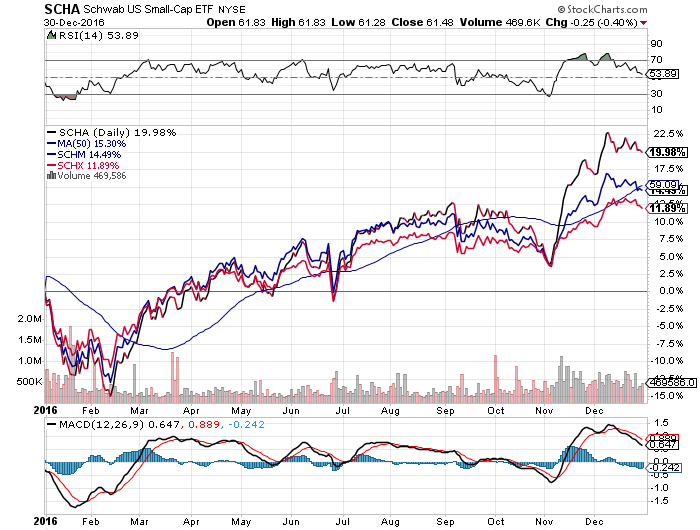
SCHA (U.S. Small Caps), SCHM (U.S. Mid Caps), SCHX (U.S. Large Caps)
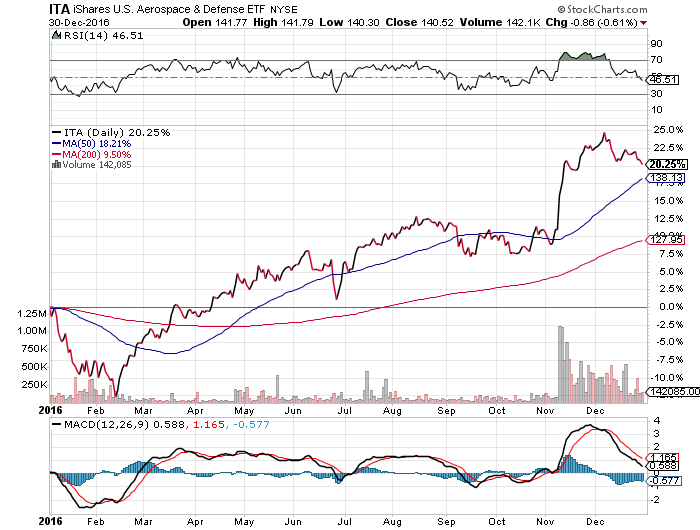
US Aerospace & Defense (ITA)
Consumer Discretionary (XLY)

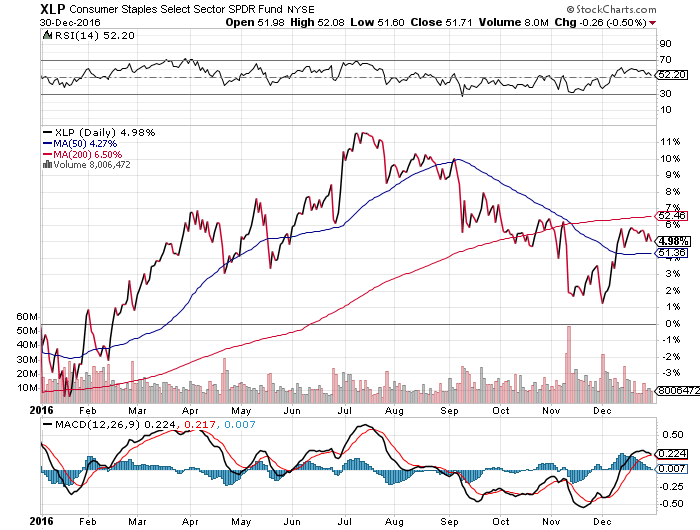
Consumer Staples (XLP)
Industrial Select (XLI)

U.S. Financials ETF (IYF)

S&P Regional Banking (KRE)

Health Care (XLV)

IBB (Biotech)

ITB (U.S. Home Construction)

IYR (U.S. Real Estate)

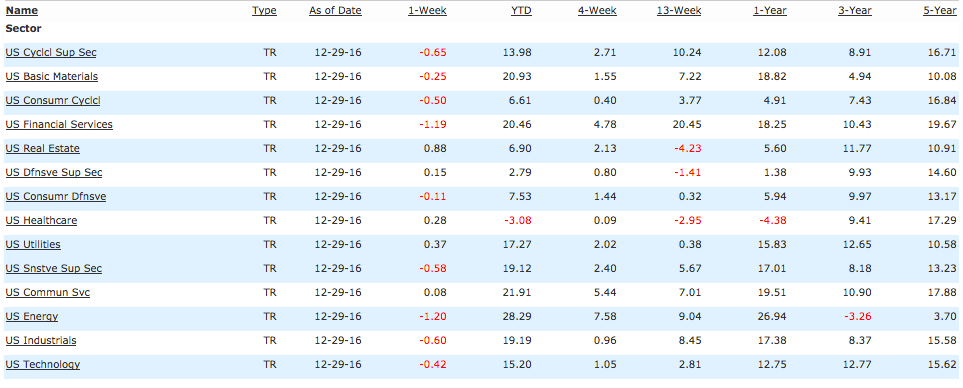
U.S. Equities: 1, 3, 5 Year Sector Performance
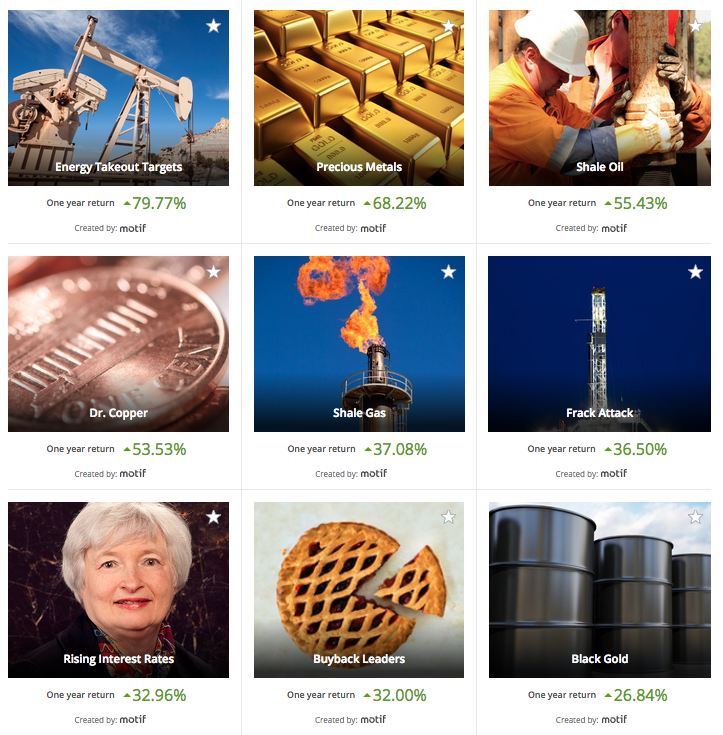
Motif Investing Highest Earners
Motif Investing Lowest Earners

EFA (International Developed)

EUROPE
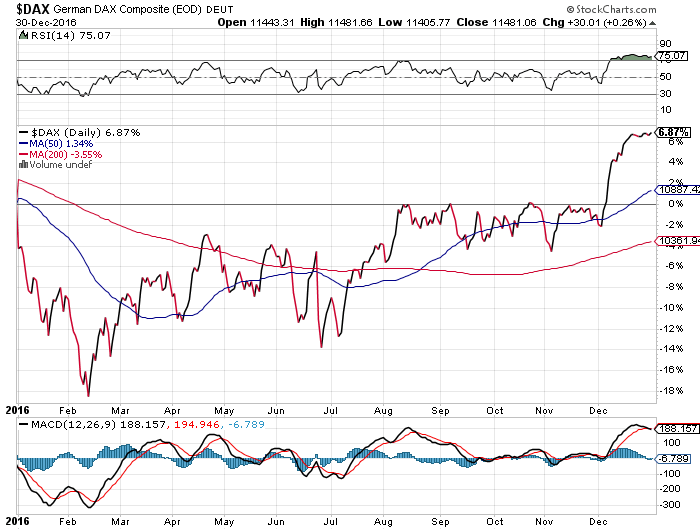
DAX (Germany)
VGK (FTSE)

VGK (FTSE), EWU (UK), SPY (S&P)

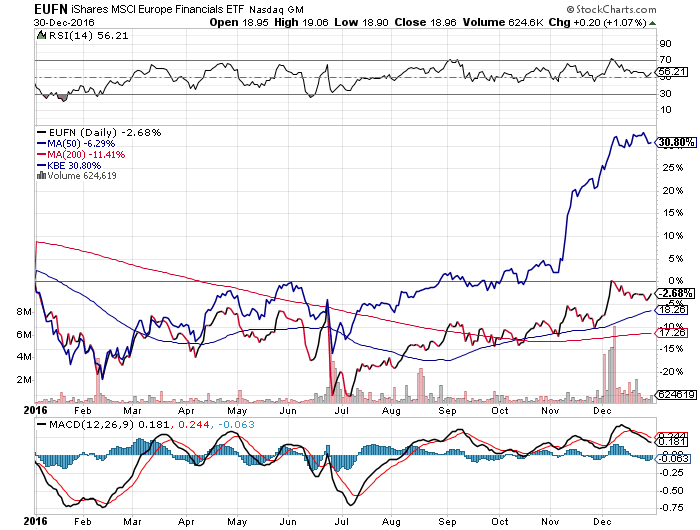
EUFN (European Financials), KBE (US Financials)
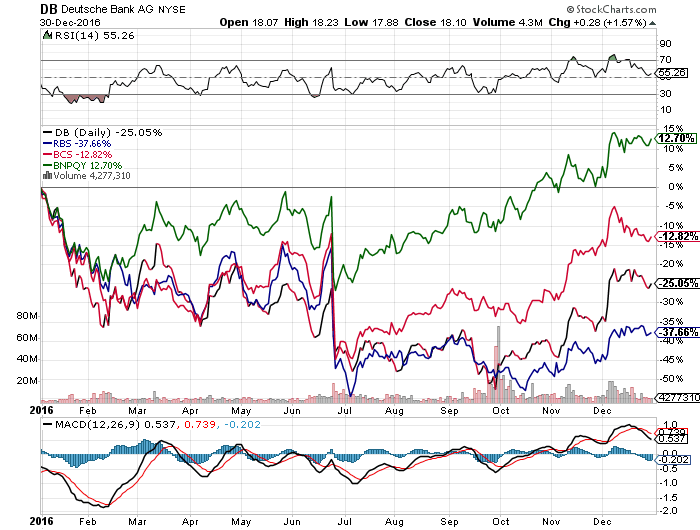
European Financials: DB (Deutsche Bank), RBS (Royal Bank of Scotland), BCS (Barclays), BNPQY (Paribas)
ASIA
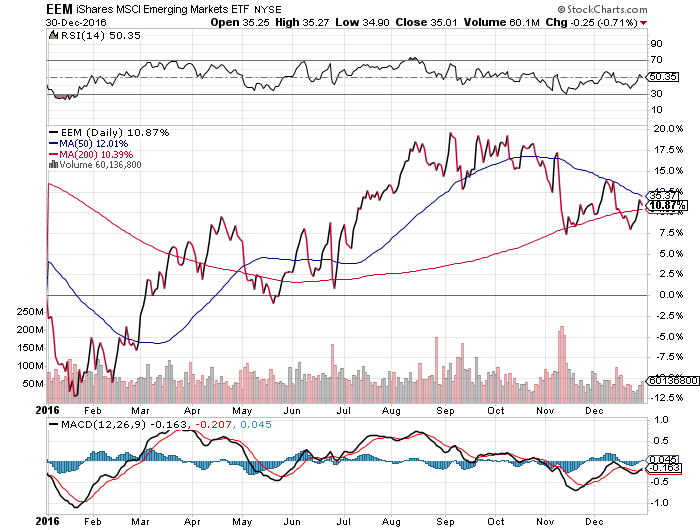
EEM (Emerging Markets)
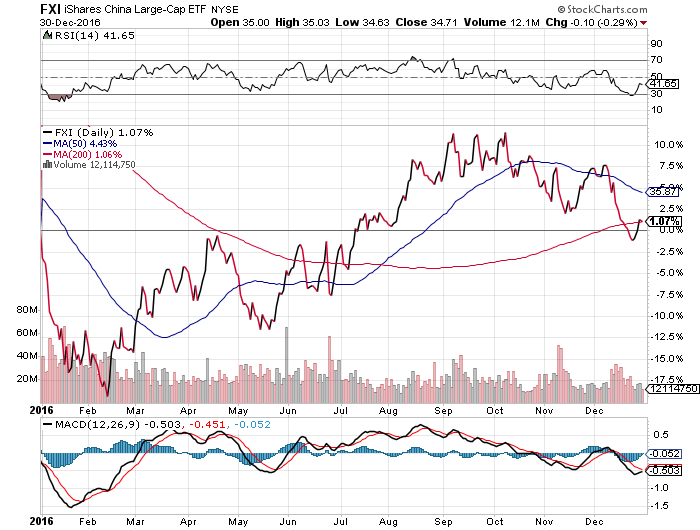
FXI (China Large Caps)
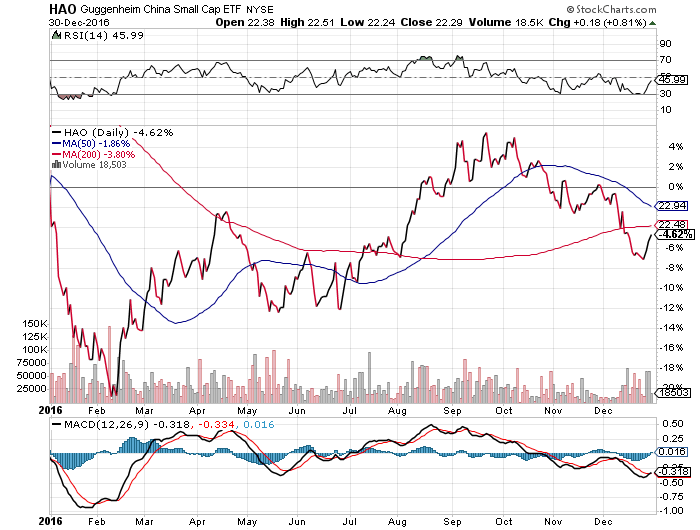
China Small Cap (HAO)
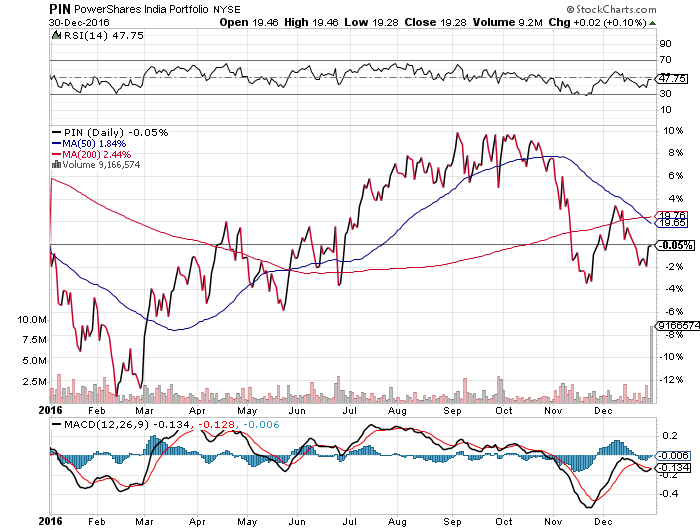
PIN (India)
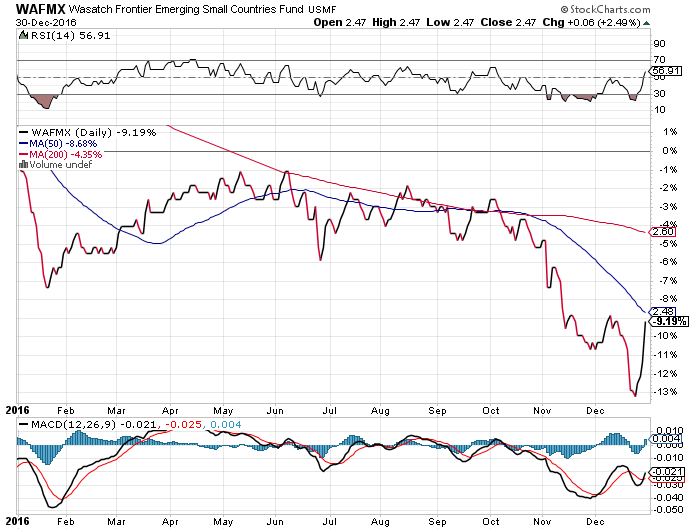
WAFMX (Frontier Markets)