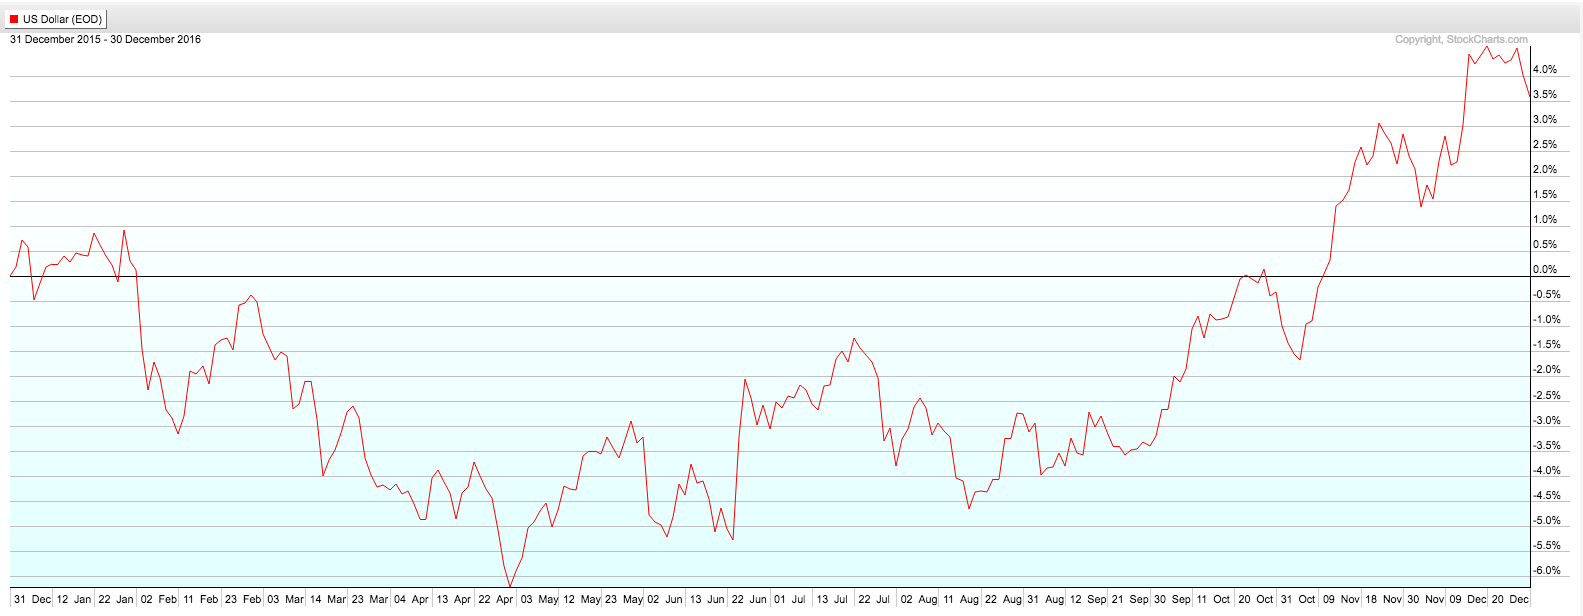
The year ended with the US dollar index breaking through the 100 ceiling and rising strongly in response to both the Trump election and the Federal Reserve raising the target range for the federal funds rate for the first time since December 2015.
By the December close, US equities outperformed equity markets in Europe, Asia, and the emerging markets. That was not expected for much of the year as fixed income, precious metals, and emerging markets rose on a roller coaster and then fell significantly by the end of the year.
US Dollar Index
Fixed Income
As we started 2016, it looked like the end of the great bond bull market had finally arrived. However, bond prices skyrocketed into the summer with the long Treasury bond ETF peaking over 20%. Then the long drop in Treasury bond prices began, giving up virtually all gains by the end of the year.
Corporate bonds outperformed government bonds. The strongest fixed income performance came in junk bonds – prices continued up despite rising interest rates. As the “Trump Thwack” dropped the fixed income markets by $1 trillion + on the heels of the US Presidential election, the consensus grew that the end of the great bond bull mark has indeed arrived. This is the ultimate confirmation that the debt growth model is over. Expect investors to maintain a nervous eye on interest rates in 2017.
Equities
After an astonishing rise in 2014, US equity markets were flat in 2015. Given the challenges facing corporations – fewer earnings, slowing labor productivity as well as a strong dollar – we started 2016 with numerous headwinds. In addition, the US equity market was significantly overdue for a 15-30% correction. While equities were outperformed by long Treasuries, gold and silver and emerging market equities as of the first half, US equities continued to rise, ending the year with a performance ahead of European, developed and emerging market equities, gold bullion, and fixed income.
Commodities
The precious metals market was on a roller coaster during 2017. Gold and silver prices rose spectacularly in the first half of the year, with mining stock prices rising 100-150% at their peak. Given the long consolidation in precious metals since fall of 2011, it seemed like the long-term bull market in gold and silver would reassert. However, prices turned, giving up significant gains by year-end. Precious metals mining stocks giving up approximately 50% but still put in a spectacular performance for 2016. Looking forward, the question for precious metals investors is whether or not rising interest rates and a strong dollar will continue to dampen gold and silver prices in 2017.
Oil also had a wild ride with prices for the OIL ETF trading down 25% and up 10% in a volatile year, with prices ending almost flat.
View Commodities and Baltic Dry Shipping Charts Here